Data Review Tool
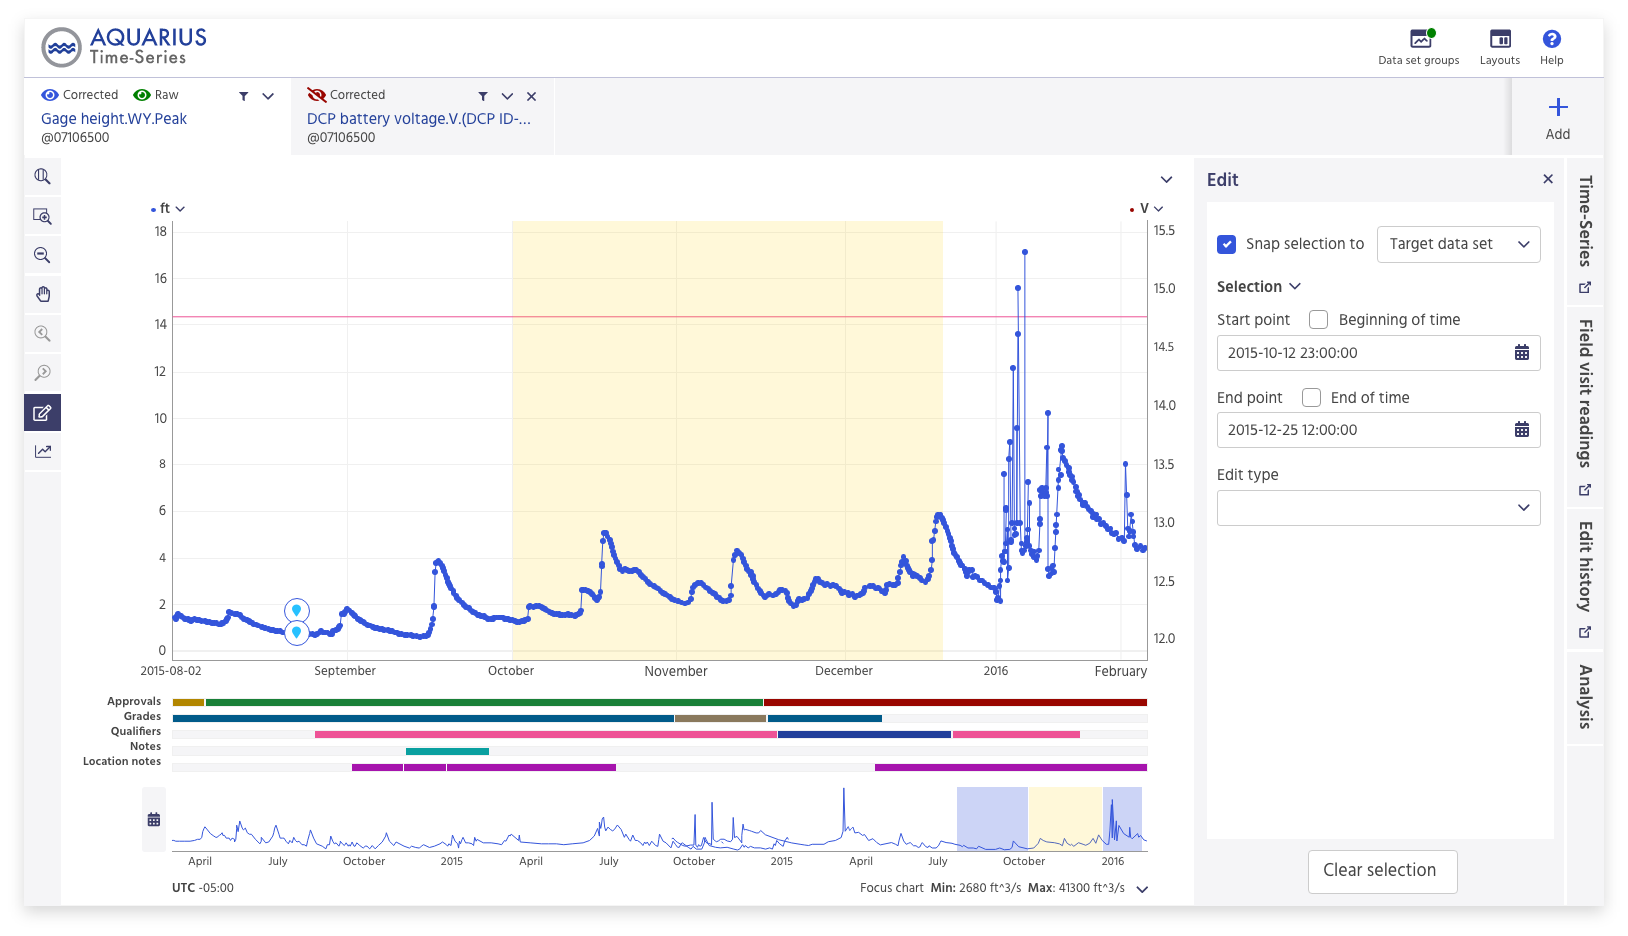
I lead the design of a browser-based water data correction tool within a scrum team of nine developers for Data Correction Toolbox. Data Correction Toolbox is software for water data technicians to correct real-time and stored data. Data sources are mechanical and manual. Data sets can be years long and include by-the-minute data points.
Data Correction Toolbox required a multifaceted design. It needed to allow comparing multiple signals, and provide a variety of manual and machine learning data correction options.
Font
I selected Hind as the font face because it is open source and it was developed explicitly for use in User Interface design.

Elements
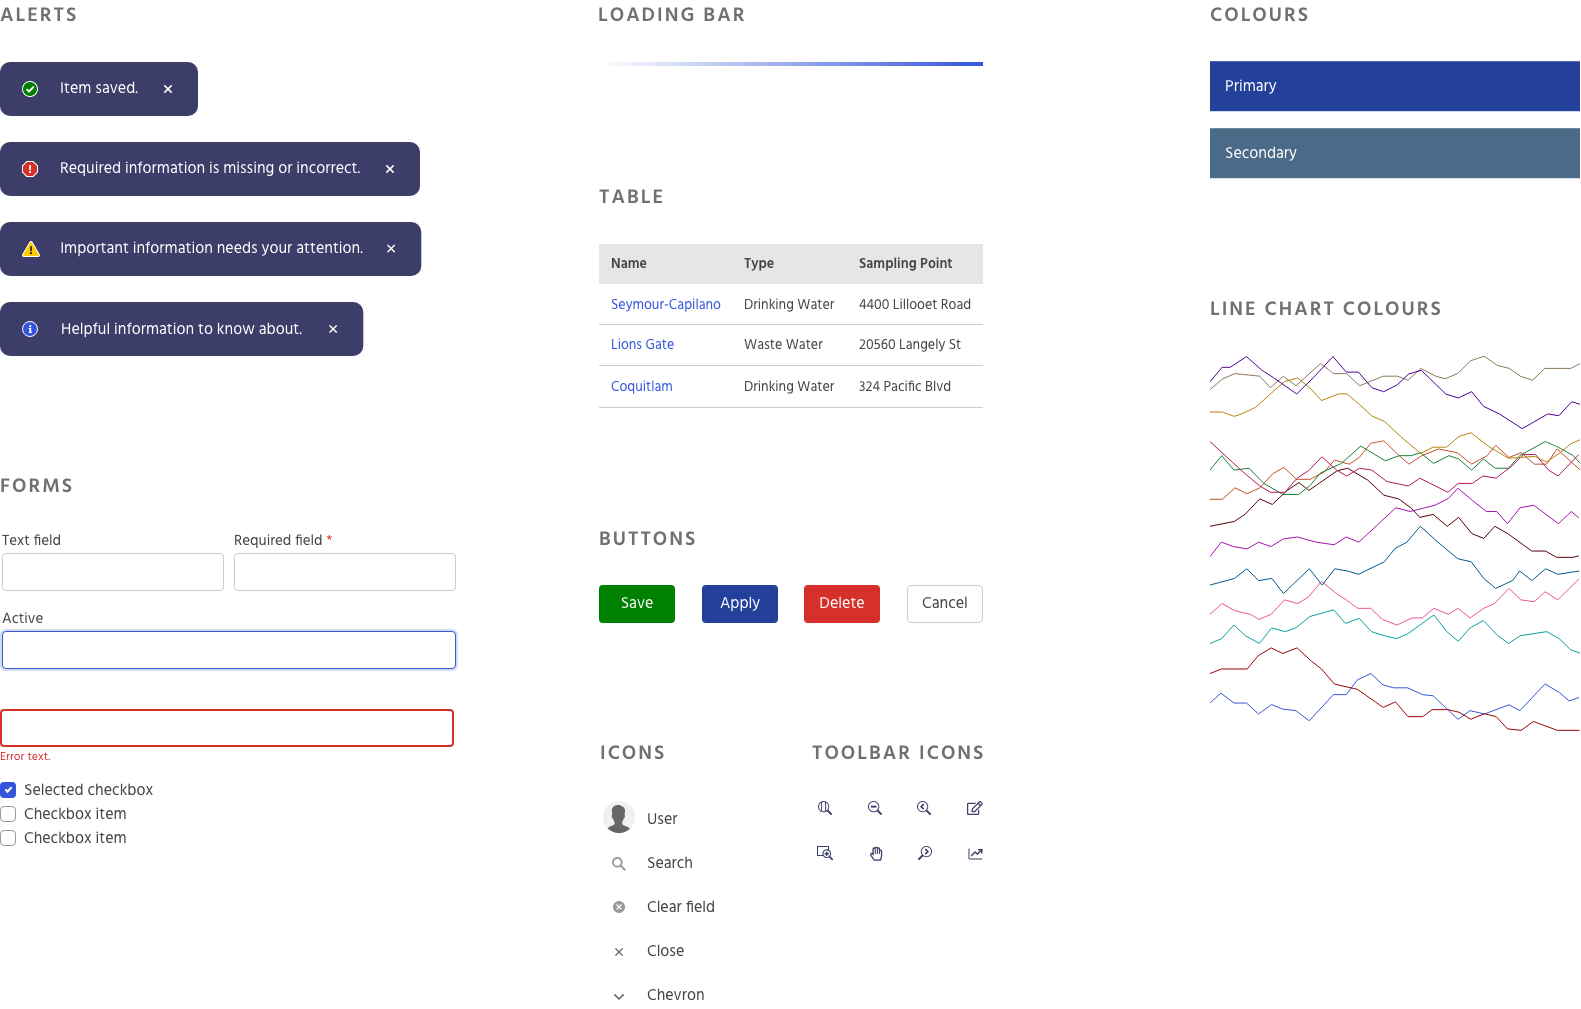
I selected colours for user interface elements to meet the Web Content Accessibility Guideline minimum contrast ratios of 4.5:1 or better. Forms and buttons were based on the Bootstrap frontend toolkit.
Highlights
Data set cards
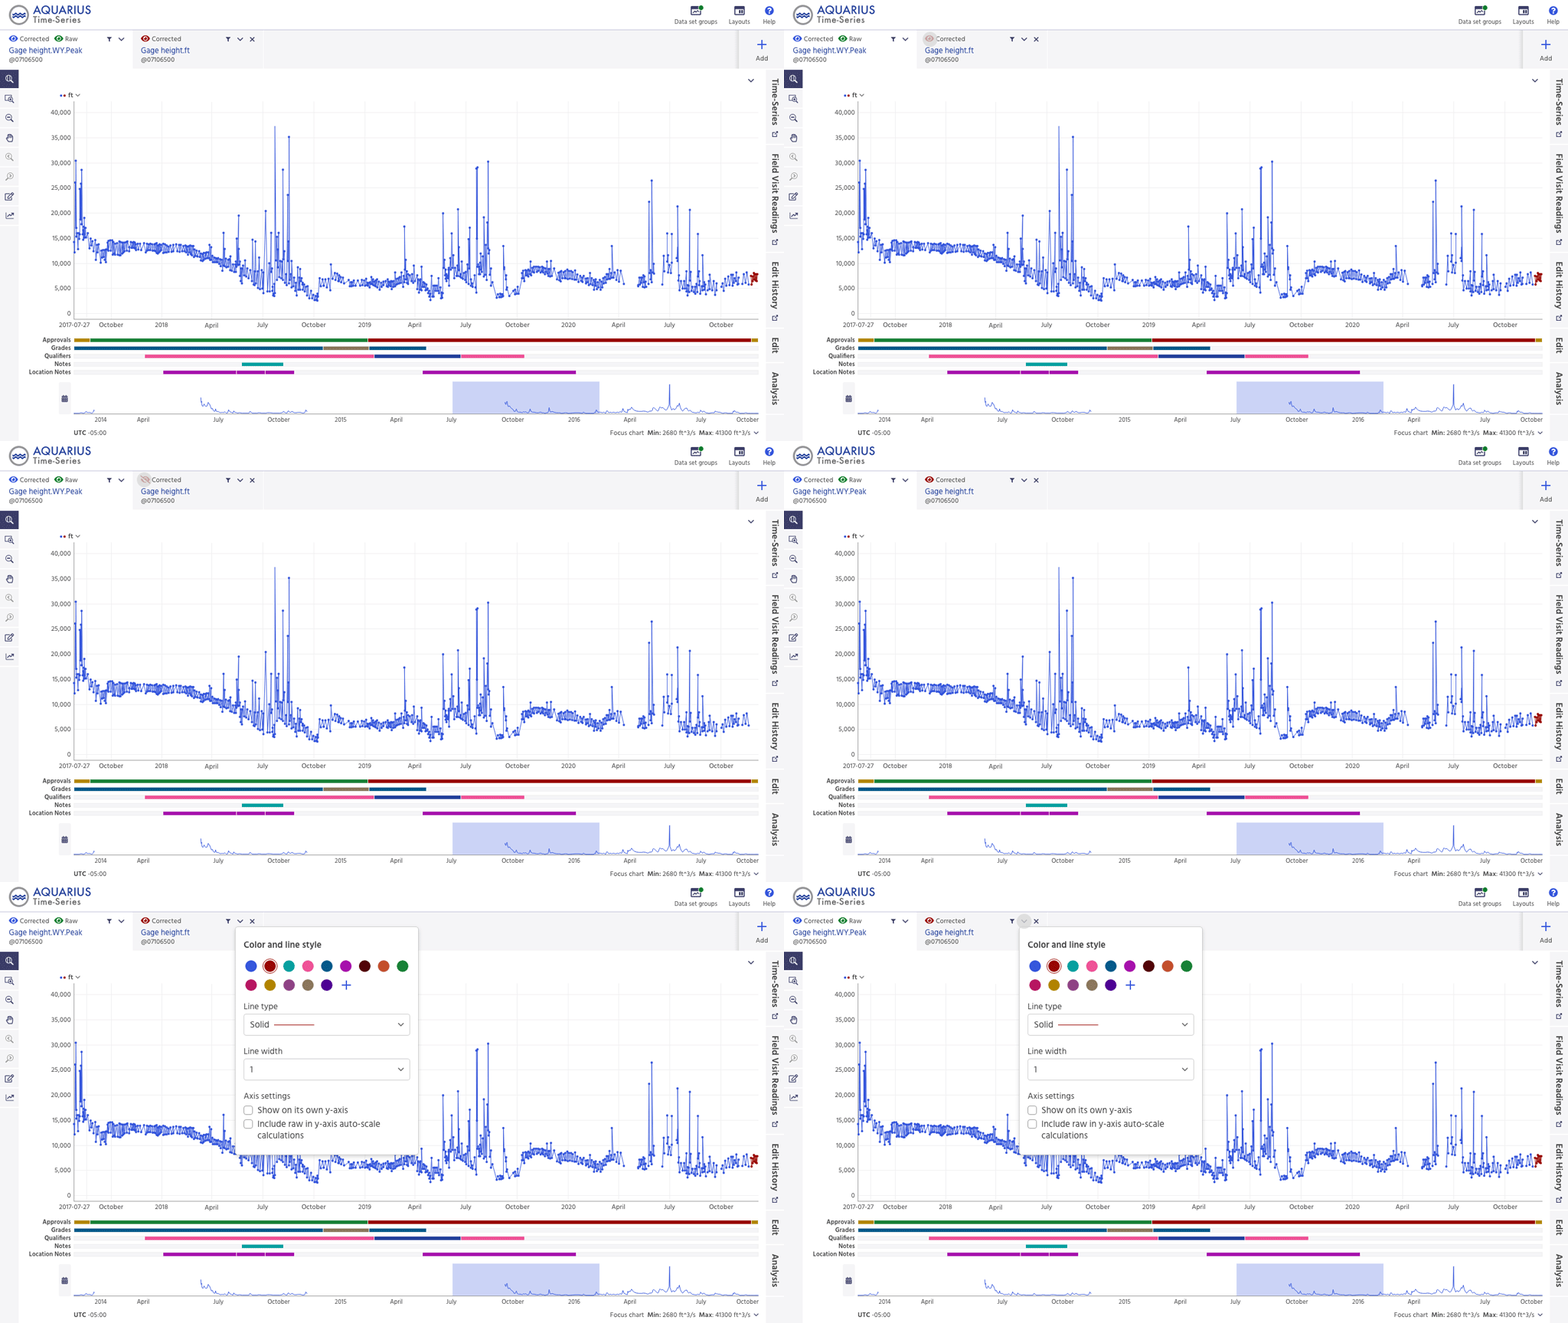
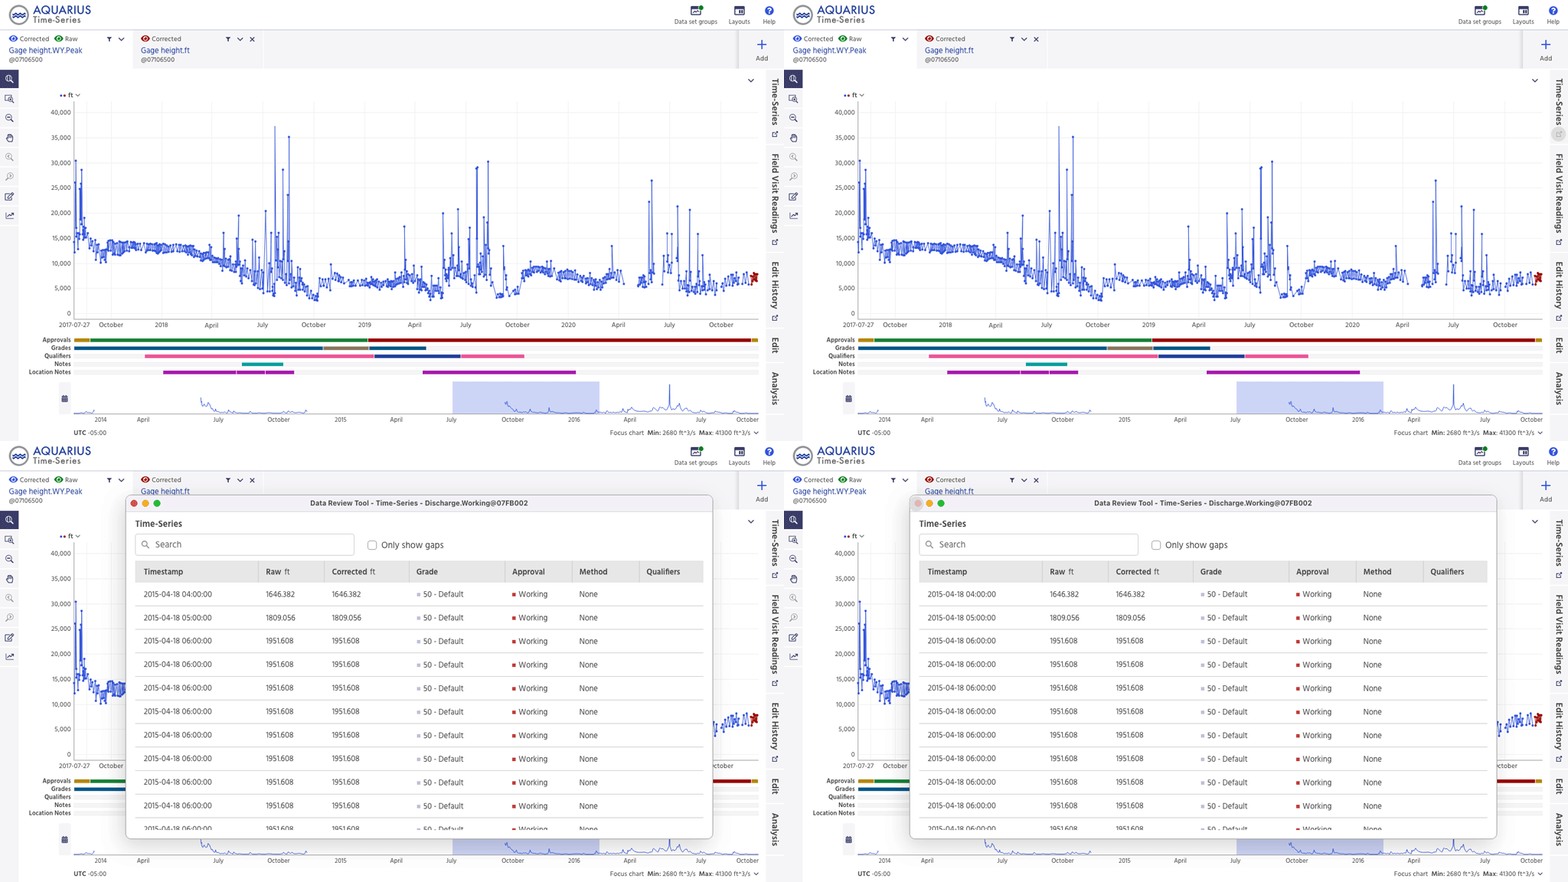
Each data set is represented by a card. Data sets can be hidden and shown quickly by using the eye icon. The data can be filtered and the style of the line chart is customizable.
Data set groups
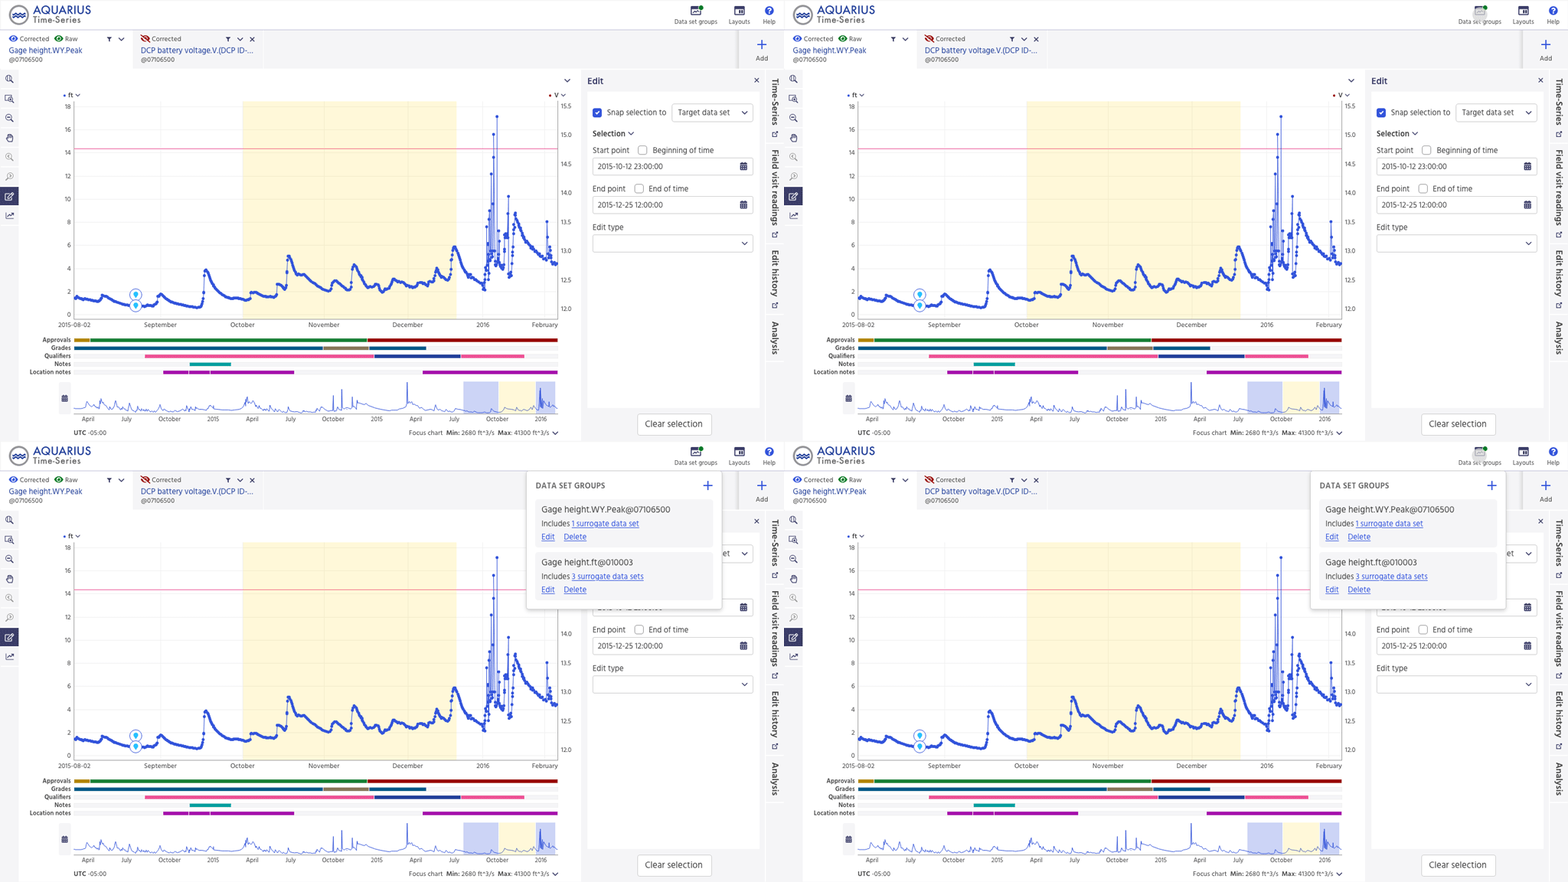
The data set groups feature allows users to save a group of frequently opened data sets for quick access.
Open in new window
For users with larger or multiple screens, panels can be opened in a new window by using the “open in tab” button.
This project is also available on Behance.
Categories: UI/UX Design